| SEARCH Flight800.org: |
| FIRO: |
| About FIRO |
| Introduction |
| Petition |
| $DONATE |
| The Evidence: |
| Eyewitness |
| Radar |
| Forensic |
| Debris Field |
|
Black Box |
| Further Research: |
| In the News |
| Crash Simulations |
| Archived Articles |
|
Related
Sites |
| Newsletter: |
| FREE Subcription |
| Contacts: |
| Contact Washington |
| Tell a Friend |
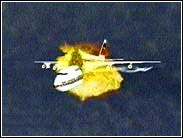
5) Failure to produce any evidence or analysis supporting a widely publicized post-failure flight path. FACT: One month before the first NTSB public hearing on Flight 800 in 1997, the FBI released a CIA-produced animation entitled "TWA Flight 800: What Did the Witnesses See." This animation was widely televised and promoted a CIA interpretation of about 1/3 of the eyewitnesses to the crash. It showed Flight 800 climbing approximately 3,000 feet after its forward fuselage broke away. "This may have looked like a missile attacking an aircraft,"[21] according to the animation's narrator. FACT: The NTSB released a study that conflicted with the CIA animation. Through a series of simulations published in the "Main Wreckage Flight Path Study,"[22] the NTSB found that Flight 800 could have only climbed a maximum altitude that was 1,700 feet less than that depicted in the CIA animation. This conclusion was based upon data that showed the plane turning "north of the pre-event course line."[22] FACT: The NTSB's 1,700 foot climb reduction was inadequate when compared to the official radar record. FACT: The NTSB Final Report on the crash incorrectly concludes that a simulation displayed in that report "matched the JFK radar data."[1] FACT: No simulation in the NTSB Final Report matches the JFK or any other radar data displayed in that report (see the highlighted data in Figure 5).
 Figure 5: Figures 28c and 28d from the NTSB TWA Flight 800 Final Report. FIRO added highlights, Line A, and labeled radar data points ten seconds after nose departure.[1] Note that the simulation data diverge from Line A (the pre-explosion flight path) well before the radar data indicates such.
FACT: The NTSB Final Report's simulations conflict with the radar data precisely when the simulated climbs begin (see Figure 5). FACT: Each simulation in the NTSB Final Report falls behind Flight 800's radar-recorded position and speed by approximately Ľ mile and over 100 knots within fourteen seconds of the loss of electrical power. FACT: The official radar record indicates that Flight 800 began an immediate descent after losing electrical power. See Figure 6 and Attachment III.
 Figure 6: Altitude vs. Time plot comparing the radar data with NTSB simulations. The NTSB simulation data shown is from NTSB Exhibit 22C. The Law of Conservation of Energy was applied to the speed data from the mean of the radar data in NTSB Exhibit 13A to calculate the loss of altitude (see Attachment III and the facts below).
FACT: The NTSB Final Report contains simulations that show Flight 800 gaining altitude and losing airspeed soon after its electrical power failed. All are in direct conflict with the radar evidence (see Attachment III). ASSESSMENT: A radar-recorded northward (left) turn[22] and the calculated loss of altitude (Figure 6 and Attachment III) could have been caused by damage to the left wing early in the crash sequence. FACT: Debris field data indicates that Flight 800's left wing was damaged early in the crash sequence.[23] FACT: A three foot by nine foot left wing structure containing both "upper and lower [wing] skin"[23] was found in an area consistent with it separating from the aircraft within five seconds of the initial explosion[24]. FACT: Other fragments of "internal and external [left] wing structure" were also recovered from the earliest debris field during trawling operations.[6] FACT: The NTSB apparently disregarded evidence of left wing damage in all published simulations. Simulations were run with both wings and all control surfaces in their original, pre-explosion condition throughout most of the simulated flight. Some wing components were simulated to have landed in a completely different debris field than where the real components were recovered.[25] ASSESSMENT: Each simulation in the NTSB Final Report and indeed all NTSB simulations published to date do not match the radar data. The radar-recorded flight path of TWA Flight 800 indicates that the aircraft immediately descended and turned left just after losing electrical power. Wreckage recovery locations indicate that the left wing was significantly damaged early in the crash sequence. Left wing damage would have resulted in a change in that wing's aerodynamic properties, which could explain much of the radar evidence. ASSESSMENT: The NTSB simulations were based upon speculative flight characteristics of a 747 after catastrophic structural failure. They were not representative of the radar data or evidence of early wing damage. The existing gap between official simulations and the evidence is significant. New simulations must be conducted that consider all of the evidence-even evidence that may negate proposed altitude gains early in the crash sequence. |